


Editor’s Note: As of January 2022, iland is now 11:11 Systems, a managed infrastructure solutions provider at the forefront of cloud, connectivity, and security. As a legacy iland.com blog post, this article likely contains information that is no longer relevant. For the most up-to-date product information and resources, or if you have further questions, please refer to the 11:11 Systems Success Center or contact us directly.
So, in my last blog, I covered best practices relating to Virtual Protection Groups (VPGs). Once you have your VPGs set up and replicated, you can monitor and manage the service through your Zerto console. With the 11:11 Cloud Console, you can also check the status of your VPG replication under the Continuity tab. Let’s take a deep dive into managing and monitoring your Zerto replication to the cloud.
The Zerto Dashboard
When you first open the Zerto console, you will see the Dashboard tab. Here, you can see a quick overview of your Zerto infrastructure. The VPG Health section to the top left shows the status of each VPG with colored blocks. Each block represents one of your VPGs, and you can view the name of the VPG by hovering over the block. The VPG Status section in the middle of the dashboard explains the meaning behind each color. The section below VPG Health has the total IOPS, throughput, and WAN Traffic of all VPGs. This is a section to see the amount of disk activity (IOPS/Throughput) on your protected servers as well as the total bandwidth used for replication (WAN Traffic). Site Topology shows a brief topology of the replication for this ZVM and typically will look similar to the below screenshot. If you are replicating other VMs to another data center or have another data center replicating your ZVM, you may see other sites listed here. The top-right section has the sum number of VPGs, VMs, and data being replicated along with the average RPO of your VPGs and compression used for replication traffic. The right section shows any active alerts, running tasks, and recent events. This is a good spot to quickly see any issues Zerto may have alerted you about, such as VPGs breaching their RPO SLA or a VRA being disconnected.
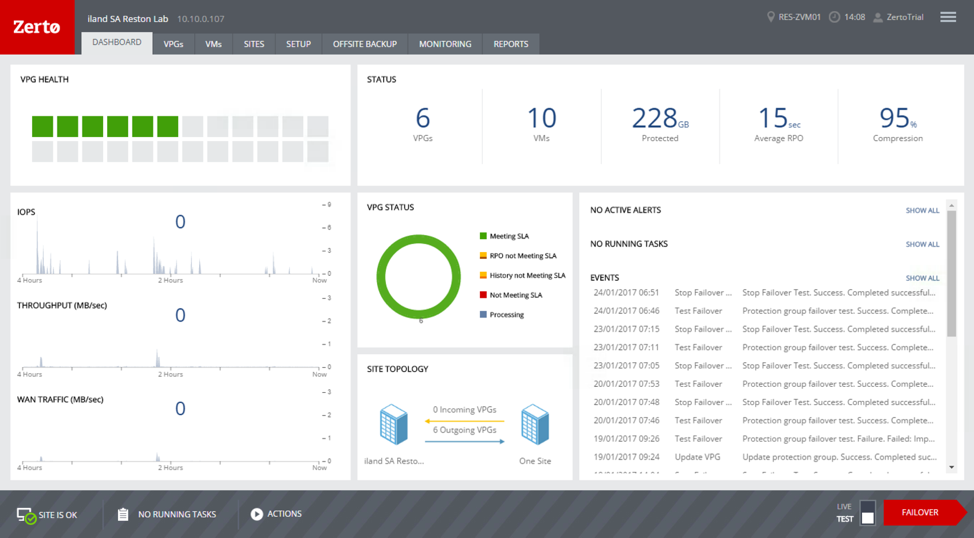 The Zerto Dashboard
VPGs
Under the Zerto VPGs tab, you can quickly see all of the VPGs you have created along with their Protection Status and RPO. You are also able to click the gear icon at the top right of the list to customize the columns for this list. You can choose to show certain stats or usage for each VPG, such as network, IO, used storage, etc. For the most part, you should see that your VPGs are replicating to an 11:11 Systems data center. You can choose to edit a VPG by clicking the pencil icon next to the VPG name and delete VPGs with the trashcan icon. To open the status page for a particular VPG, you can just click the VPG name. For information on understanding the VPG status page, please visit a previous blog I’ve written on this topic here. You can also make changes on several VPGs – like pausing or resuming – by checking the desired VPG’s checkboxes and clicking the “More” dropdown.
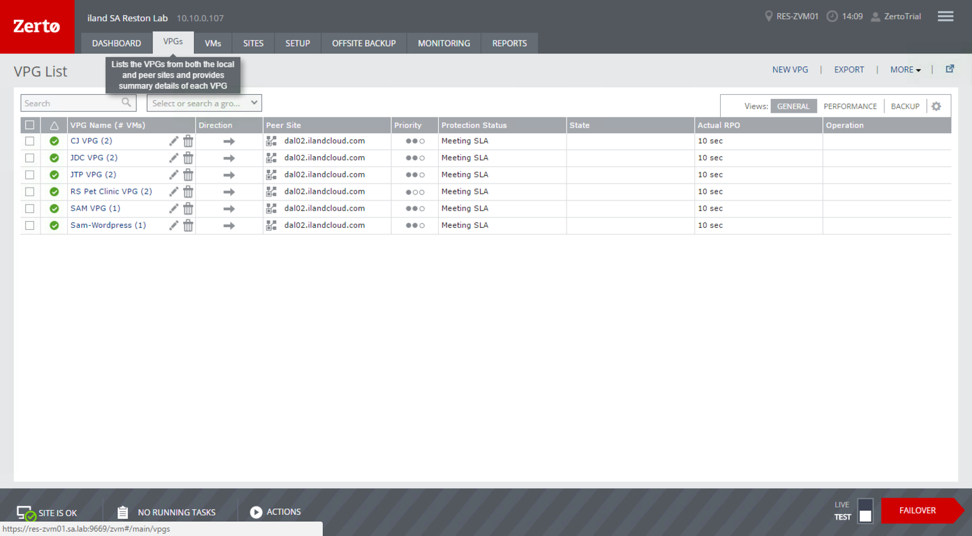 The Zerto VPGS list view
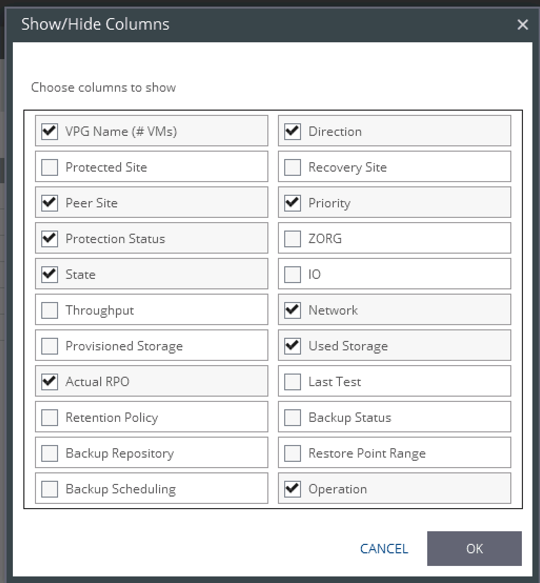 Customizing the columns shown in the VPG list view
VMs
There is a VMs tab where you can get a view that is very similar to the VPGs tab, but you will see the individual VMs. This is a great spot to monitor the performance and usage of particular servers, but it is recommended that you do not make any changes from this view. Since replication and failover are handled at the VPG level, you will want to make changes through the VPG. For instance, if you want to remove a VM from replication, you will need to edit the VPG it is in and remove the VPG from there. Selecting to remove a VM from the VMs view will remove the entire VPG.
Setup
The setup tab will list and display the status of your VRAs. If you have errors regarding communication on a VPG, this is a good place to look first to ensure that your ZVM is able to communicate with all VRAs. If you have a VRA that shows as disconnected or has an error, VPGs that use that VRA will have an error. Your first step should be to make sure you are able to ping to the VRA address to confirm connectivity from the ZVM server. You can also get a glance at the number of VPGs and VMs being processed by this VRA. Clicking the VRA name will give you a status of the VRA, including RAM and CPU usage. If you notice that one VRA is allocating the majority of your protected servers, it may be a good idea to spread the load across less-utilized VRAs.
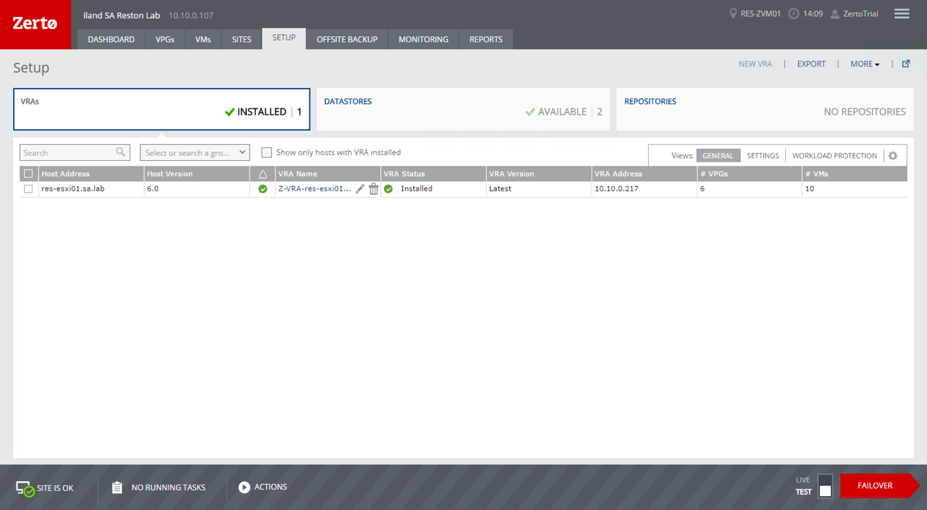 The Zerto Setup Tab
Monitoring
The Monitoring tab will display any active alerts. There may be alerts that you are aware of, such as a network disconnect or if you power off a VRA for host maintenance. In those cases, you can check the alerts and click the “Acknowledge” button near the top right of the screen. You can also click the “Events” and “Tasks” boxes to see recent activity on your VPGs, such as updates, failover tests, or other tasks.
Reports
The Reports tab allows you to view graphical information over a period of time. The VPG Performance report will give you a look at the RPO, IOPS, throughput, and WAN Traffic used over the last 24 hours. You can also change the report to view the resources of the protected VMs or Outbound Protection Over Time. You can also use the Recovery Report after performing a failover test. This allows you to export a PDF summary of the VPGs tested to view the timestamps, tasks, and results of the failover.
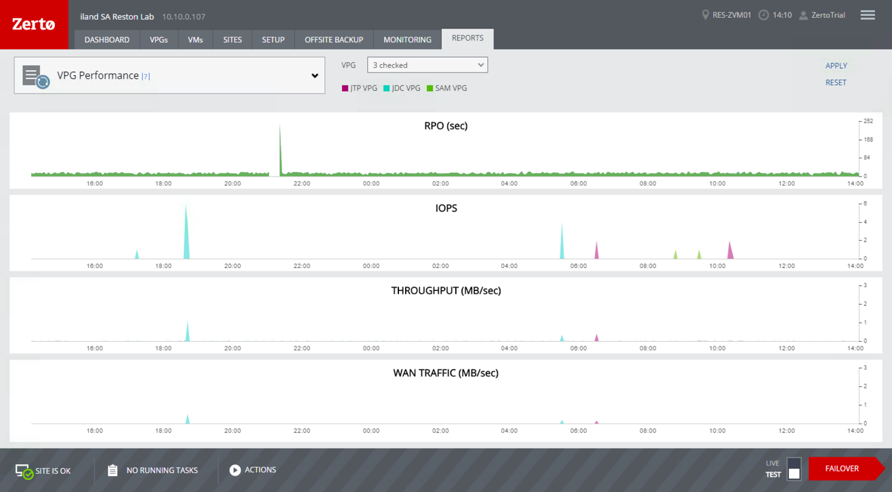 The Zerto Reports view. You can change the report
Site Settings
You can set email alerting as well as “Throttling” through Site Settings in Zerto. To get to the Site Settings, click the three horizontal bars in the top right of the console, and choose Site Settings. The site information should be filled out already, as that was input during the installation process. However, you can set throttling here under the Performance and Throttling tab. You may want to use this if you wish to limit the amount of bandwidth used by Zerto. Note, this will limit the bandwidth of the full site. You are not able to restrict bandwidth on a per VPG basis. It is recommended not to change any of the full settings here unless told by 11:11 or Zerto support.
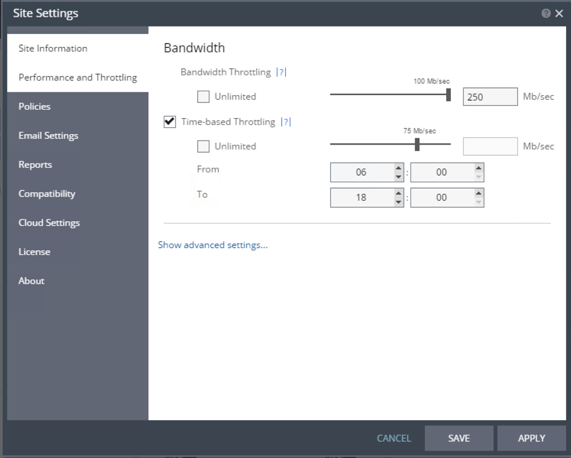 Bandwidth Throttling under Site Settings
Under the Email Settings tab, you can add the information for your SMTP server to enable automated alerts. At this point, the alerts are not very granular, and you may be alerted quite often if there is a VPG that breaches its RPO but is not critical. In these cases, you may need to either increase the RPO Alert setting in the VPG or set up a rule in your inbox for these messages.
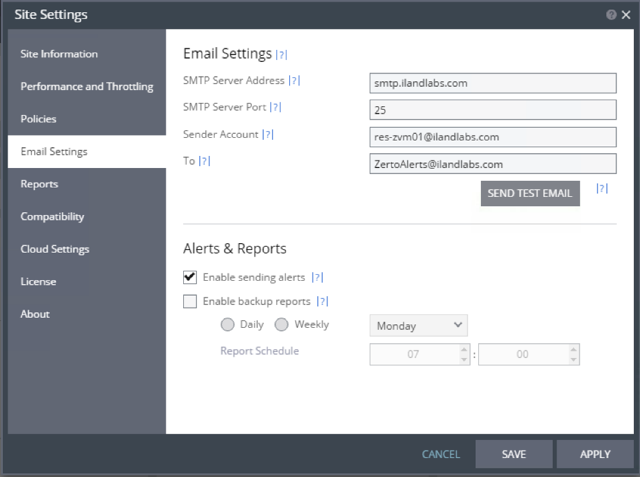 Email Settings under Site Settings
Monitoring in the 11:11 Cloud Console
With the 11:11 Cloud Console, you can also view the status and past performance of your VPGs. After you log in, you can click on the Continuity tab in the console to view your VPGs created, check recent tasks, and even conduct a failover or failover test. The 11:11 Cloud Console pulls the information from the 11:11 Zerto servers and should match what you see in the Zerto console. By clicking the name of one of your VPGs, you can see the current status and VMs included as well as graphical data for the RPO, IOPS, and throughput. These graphs can display real-time statistics as well as the last day, week, month, or customer views. By clicking the “Failover Wizard” button near the top right, you are also able to conduct a failover test, or in the case of your data center being completely offline, a live failover.
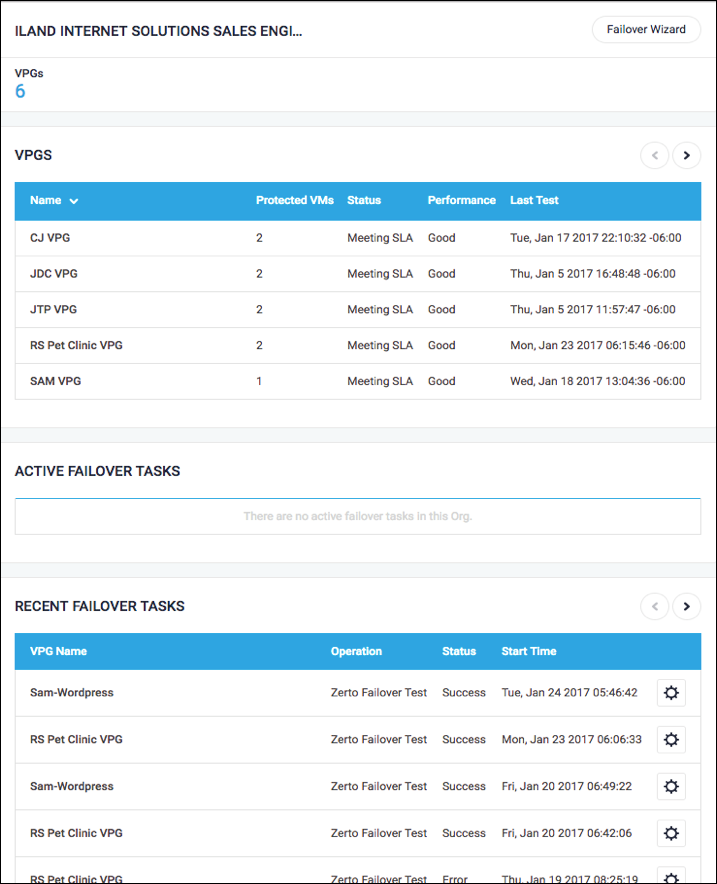 The Continuity view in the iland Secure Cloud Console
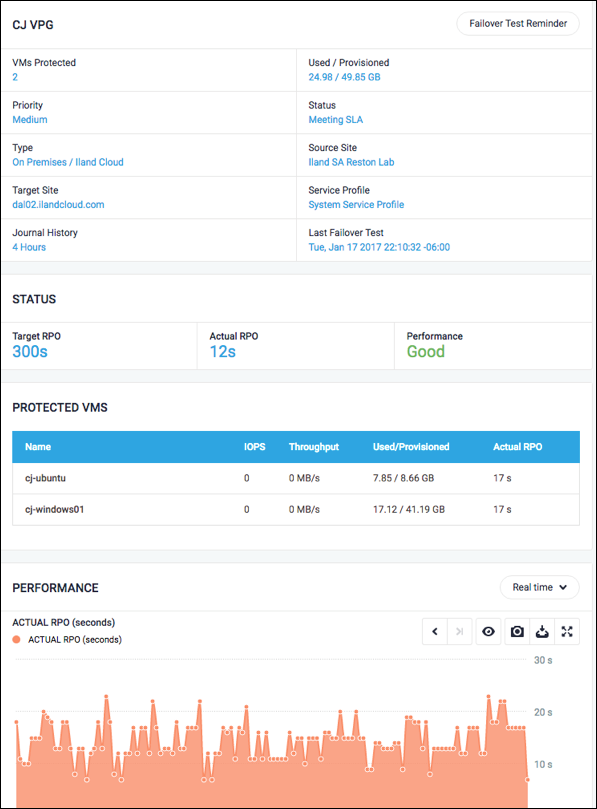 The VPG view in the ECS Console
With Zerto replication to 11:11, you are always able to view the status and performance of your VPGs. If you notice odd behavior or see active alerts, the 11:11 support team is readily available to assist in any troubleshooting to resolve issues. I hope I’ve been able to give you some insights into the benefits of Zerto VPGs combined with the visibility into these VPGs available through the 11:11 Cloud Console to help you optimize and refine your DR environment. In my next blog, I’ll cover Zerto failover considerations and best practices – stay tuned!