


To get the most out of a Zerto Disaster Recovery solution, it’s important to understand Virtual Protection Groups (VPG) and how to manage them optimally. VPGs enable grouping and tiering of VMs for protection which ensures consistent recovery points (RPOs) across all grouped machines. In this blog, I’ll take a technical deep dive into VPG management.
When you finish creating a VPG (Virtual Protection Group) in Zerto, you will be directed to the running VPG page. This shows you real time statistics of the VPG performance and status. This page may also be accessed from the VPG tab by clicking on a VPG name.
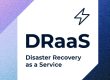
When you first open this page, you will see something similar to the image below. You can see the VPG name, current status, included VMs as well as performance and configuration information. Let’s review these sections to get a better understanding of what information is being displayed.
A VPG in Meeting SLA Status (Fully Synced)
Status:
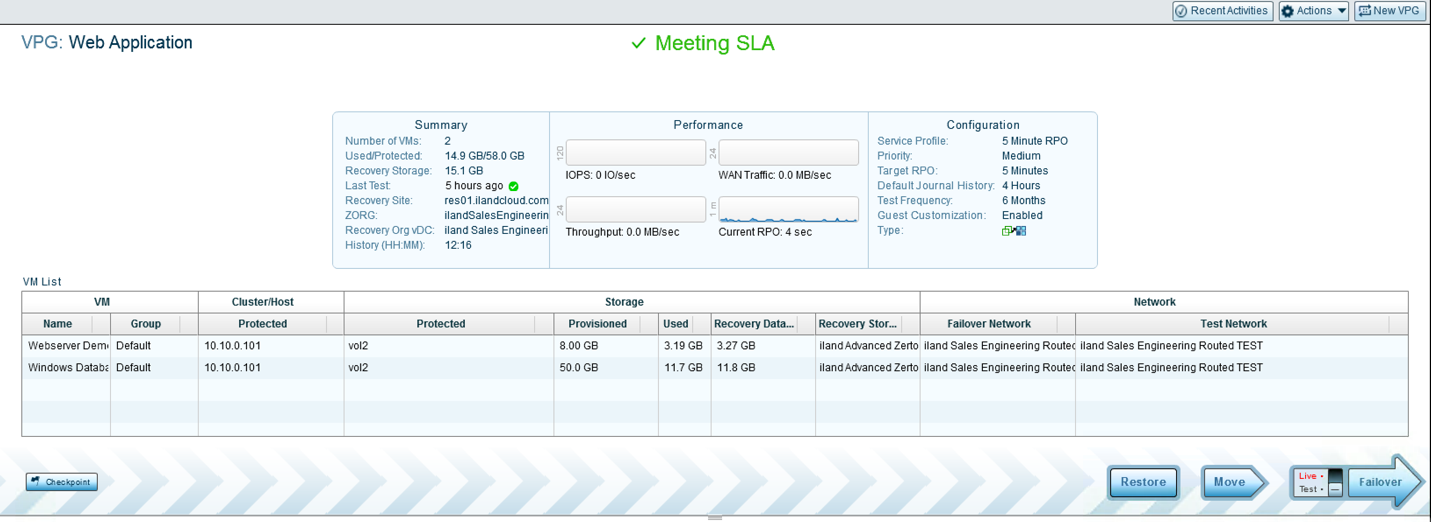
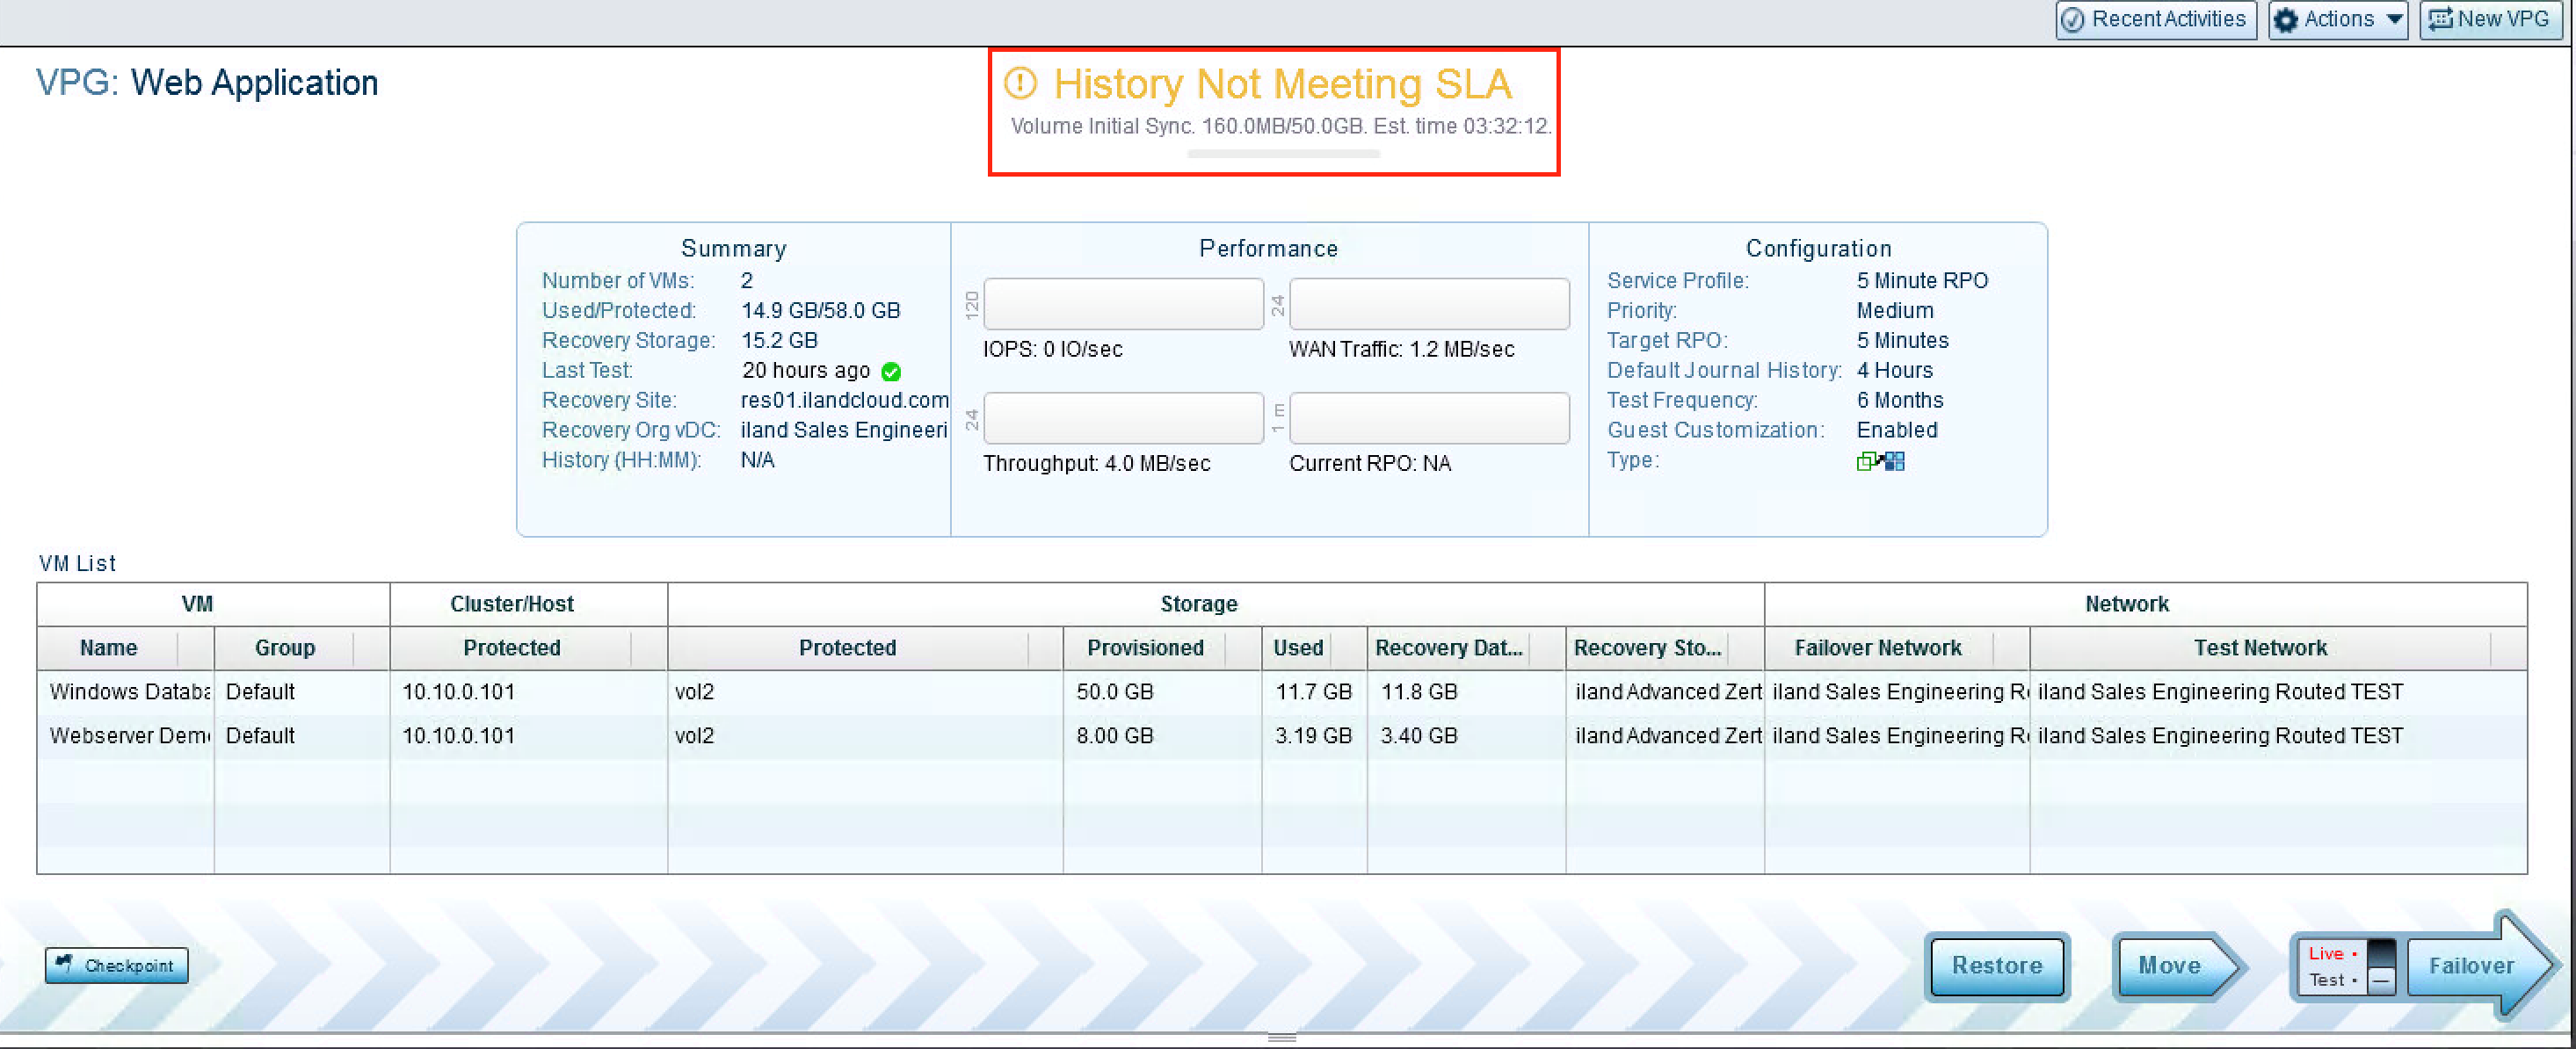
Your Zerto VPG will typically have a “Meeting SLA” status in green. This lets you know that we are receiving checkpoints within the requested RPO (Recovery Point Objective) time. However, you may see other statuses, such as “History Not Meeting SLA”, “Initializing,” or “Not Meeting SLA” due to a Bitmap or Delta sync. These are very common to see, especially when you first begin replication with Zerto. The “Initializing” status means the VPG is replicating the data of the included VMs for the first time. Under the status, you will see the progress of the initial sync with the amount of data that has currently been replicated and the total amount of data to be replicated. Next to that you will have a dynamic ETA, that will change as more data is replicated and as more or less bandwidth is being utilized. When in a “Bitmap Sync” Or “Delta Sync” state, you will see a similar view to the below image. These statuses typically appear after the VPG has been paused or replication was stopped and then resumed. Another common status is “History Not Meeting SLA.” This commonly appears when there has been a change to a VPG, such as adding a new VM or disk, or immediately after completing the initial sync. This means that replication has completed for the VPG at one time, but you have not replicated long enough to fill your replication journal. If the VPG has been configured for a 4-hour journal history, this status will show until the VPG has replicated for at least 4 hours. Once that is completed, the status will change to “Meeting SLA.”
A VPG that is Initializing a new VM with a “History Not Meeting SLA” Status
A VPG that is showing a Bitmap Sync state with a “Not Meeting SLA” Status
Summary and Configuration:
Below the status of your VPG, you will see three sections regarding the Summary, Performance and Configuration of your protection group. On the left hand side, you see the Summary section. This has information regarding the number of VMs in the VPG, the total amount of used and provisioned data of the VMs in the VPG as well as iland recovery site information. At the bottom, you will see a section for History and this displays the length in time you are able to recover to. This number is displayed with hours and minutes – so for the image below, you would be able to fail back to 12 hours and 16 minutes prior. The right hand side has the configuration details of this particular VPG. You can view the Priority of this VPG in regards to bandwidth, the Target RPO, Default Journal History, Test Frequency and Guest OS Customization enablement. These settings are determined when creating the VPG and can be changed after the VPG is created.
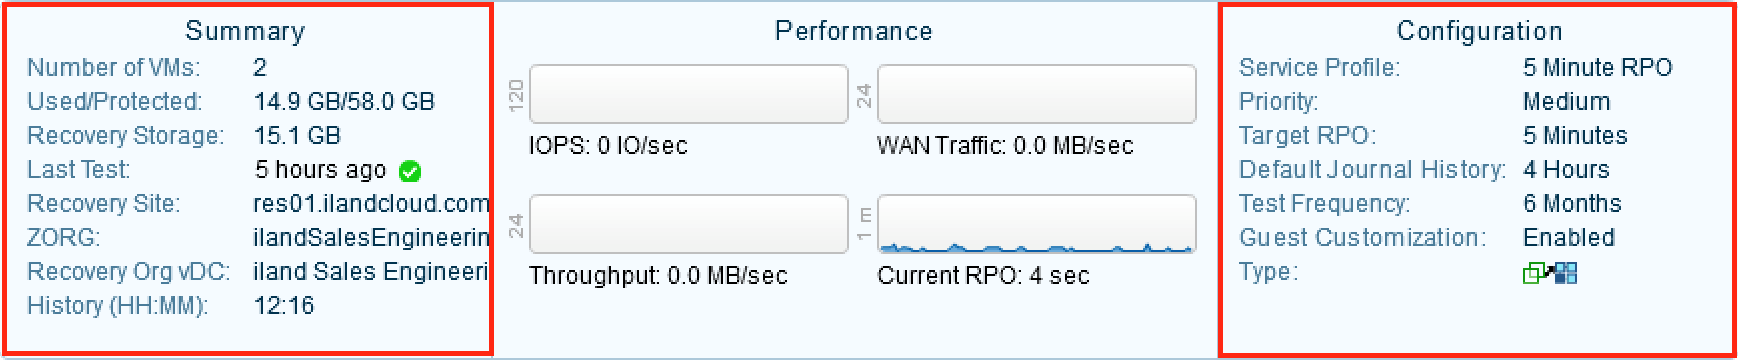
The Summary and Configuration sections of a VPG highlighted in red
Performance:
In between Summary and Configuration, you will see the Performance section. Here you can view the IOPS, Throughput, WAN Traffic and the Current RPO. These graphs can be very important when trying to pinpoint the root cause of frequent Bitmap or Delta Syncs. Let’s discuss what each graph means:
IOPS (I/O Per Second) – This is the input and output operations of all VM’s disks included in the VPG. This metric is being pulled from the Production VM and gives an idea of disk activity on the production server(s). This usually indicates the number of operations on the protected VMs per second.
Throughput – This is the performance or processing rate of the disk. Again this metric is pulled from the Production VM. This would indicate the processing power to perform an operation. When using IOPS and Throughput together, you can accurately determine if there is one large change or many smaller changes.
WAN Traffic – This is the actual data being passed from the protected site to the target site. This is where you can tell if the VPG is replicating data or sitting idle.
Current RPO – This value is the current RPO (Recovery Point Objective) of the VPG. Typically, you may see this number in the range of 5 to 15 seconds, meaning that every 5 to 15 seconds a new checkpoint to restore to is being created in the target site. When this time exceeds the Target RPO set in the VPG, Zerto can alert you and may indicate a network issue.
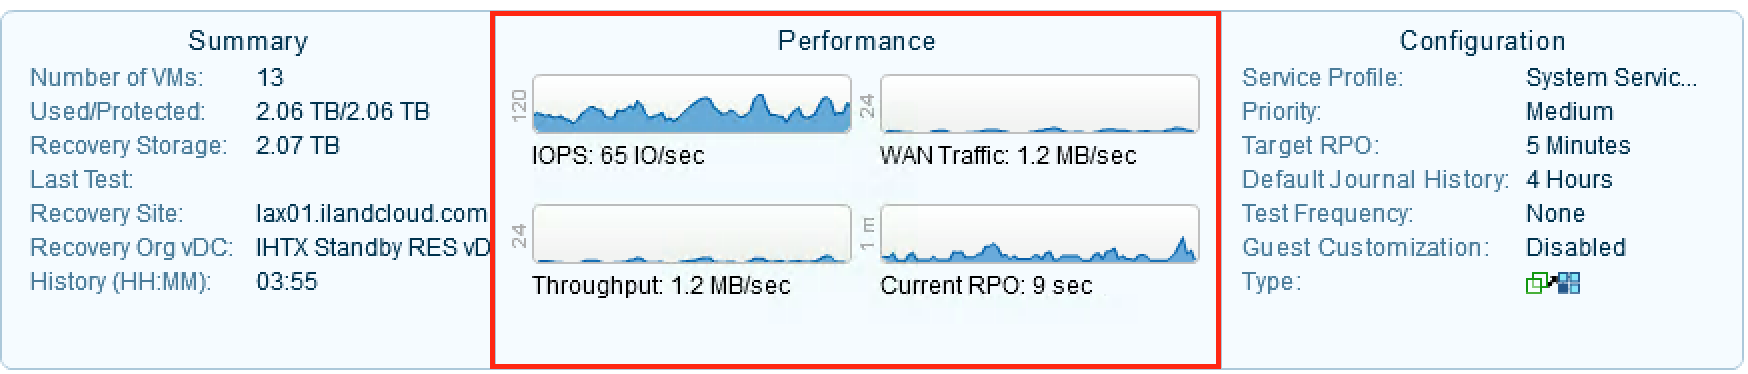
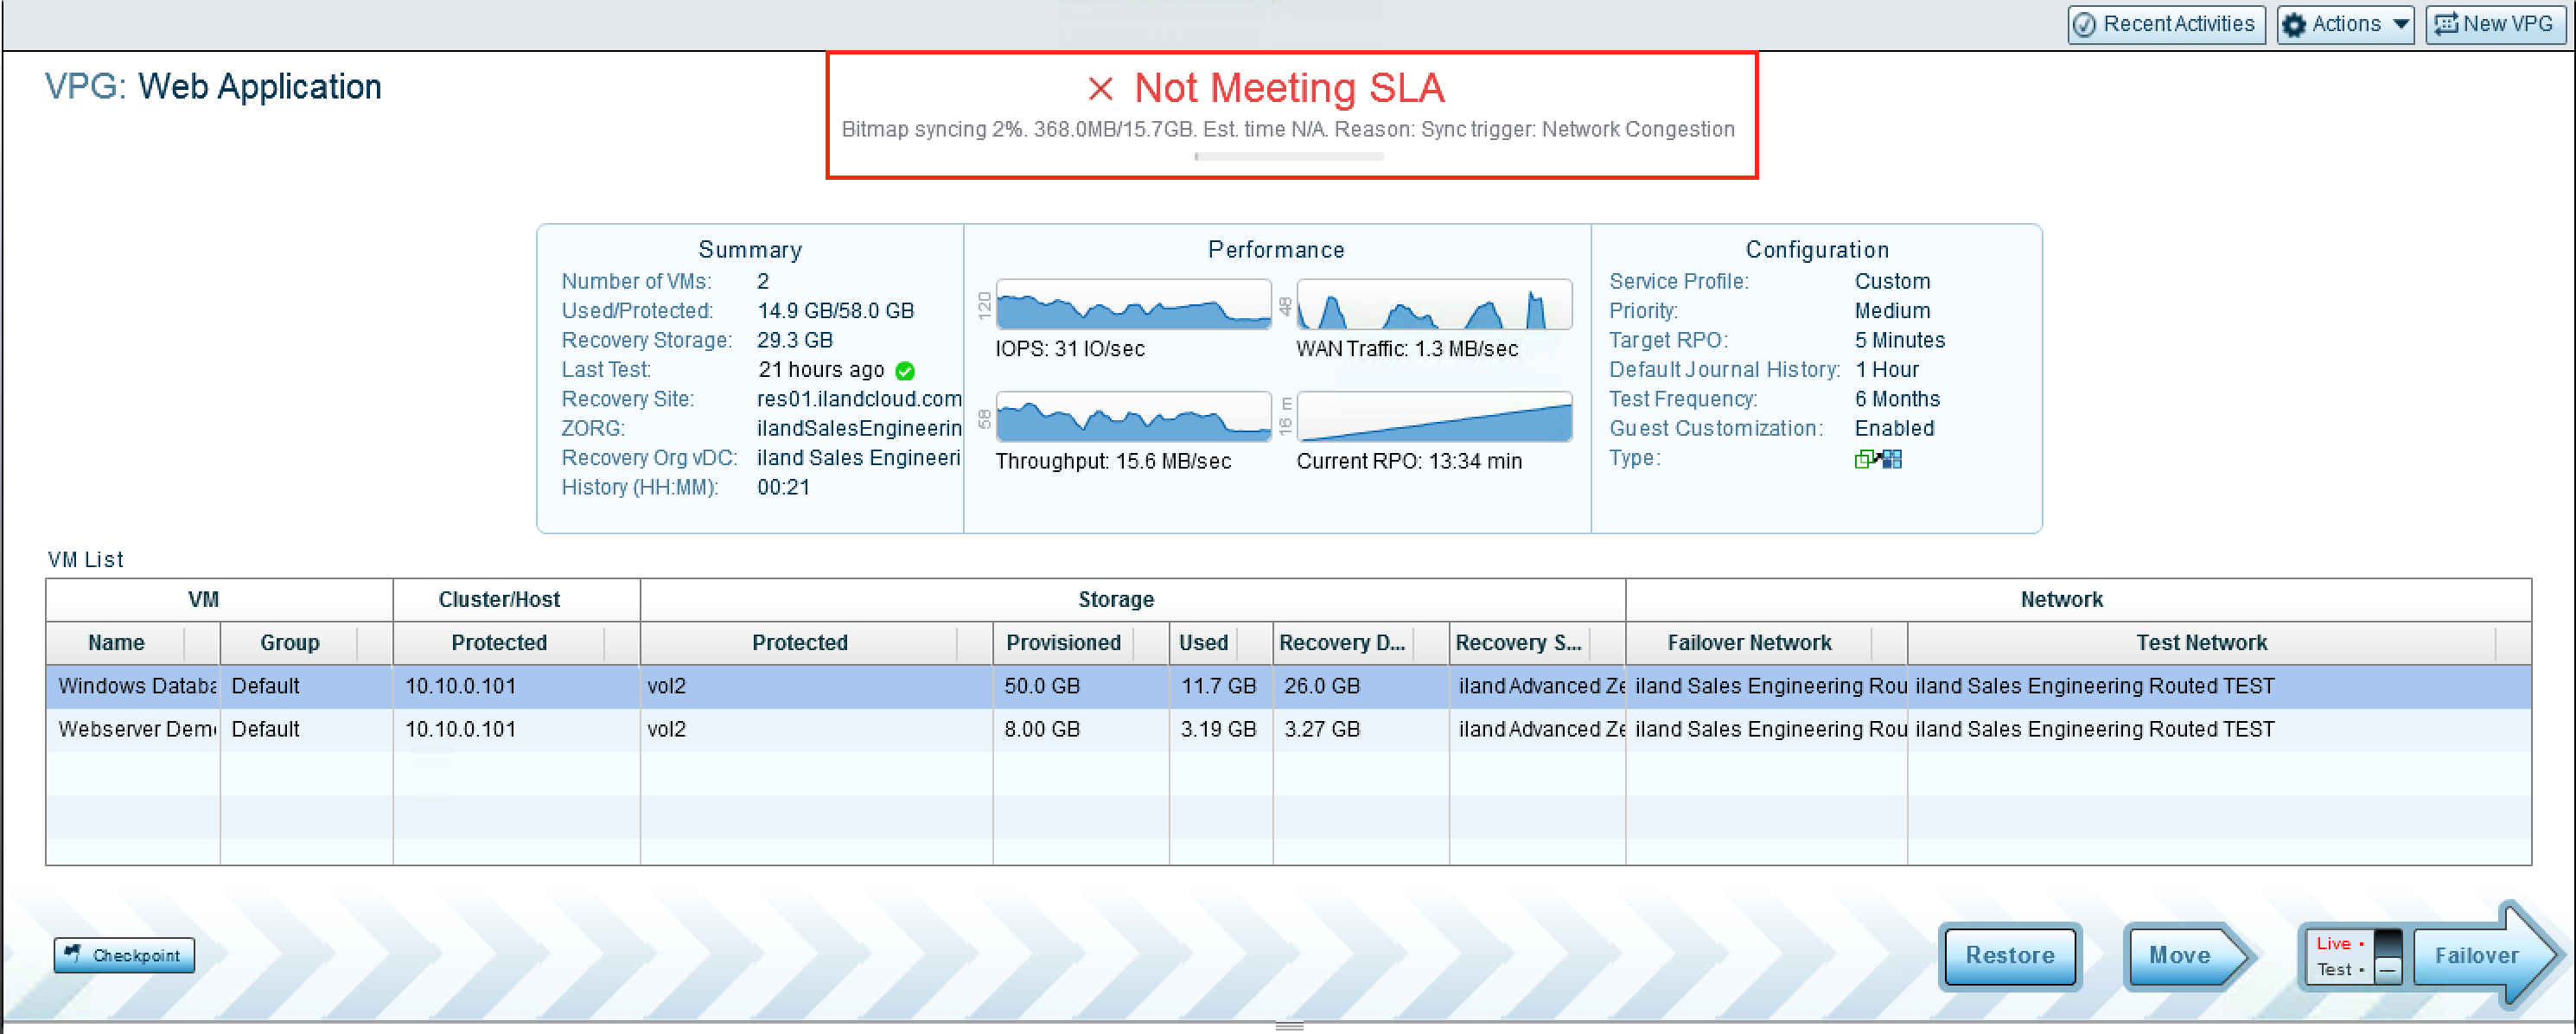
The Performance section of a VPG highlighted in red
In the image above, we can see that the IOPS is at 65 IO/Sec or 65 read/write operations per second. The Throughput, however, is relatively low – around 1.2 MB/Sec. This indicates a lot of operations are being performed on the disk, but they are not very taxing on the actual disk performance. We can then see that the bandwidth is able to keep up with the change rate and we are seeing 1.2 MB/Sec being replicated across the WAN. With this performance, our VPG is currently sitting at a 9 second RPO – i.e., it is able to create a new checkpoint every 9 seconds.
When looking at these graphs, you can get a great picture of the Zerto performance and load on the real time replication. Zerto can only replicate as fast as the bandwidth between the two sites allow. If the VMs in the VPG are making changes that exceed bandwidth capabilities, the VPG may enter a Bitmap Sync state. When a protected VM makes a large change on it’s disk, such as a backup or large database query, you may see the IOPS and/or Throughput increase. Depending on the size of the change, you may also notice WAN Traffic decrease and Current RPO begin increasing. This happens because the changes to the protected disk create too high of a load for the WAN Traffic. The VPG will essentially halt WAN replication and begin to cache the changes on the Zerto VRA (Virtual Replication Appliance). Once the change has completed, WAN Traffic will begin to increase and Zerto will send all cached changes to the target site to sync back up to a “Meeting SLA” status.
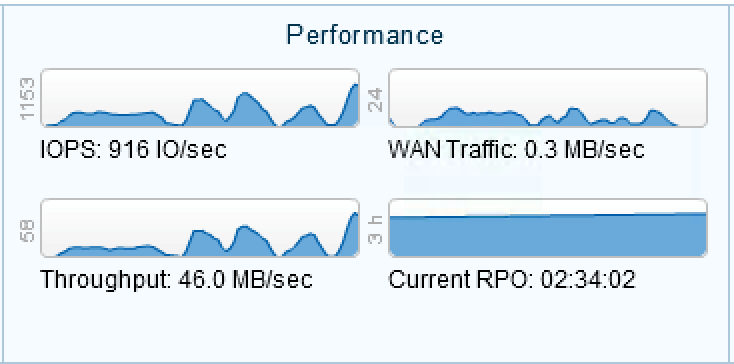
A high increase in IOPS and Throughput causing a drop in WAN Traffic and an Increase in the RPO.
This does not necessarily constitute a network or configuration issue, but rather an overload of data for the VPG to replicate in real time with its bandwidth allotment. Resolutions to this might be to separate highly utilized servers into their own VPG or excluding disks that are used for backup storage. Each situation can be different and investigating the performance along with working with iland Support can help prevent further Bitmap Syncs.
iland delivers cloud-based Disaster-Recovery-as-a-Service with Zerto that replicates VMs at the hypervisor using any tier of storage. For more info, go to our Zerto page.
If you have suggestions for other technical topics relating to disaster recovery or other cloud services you’d like me to cover, please let me know in the comments section below.